
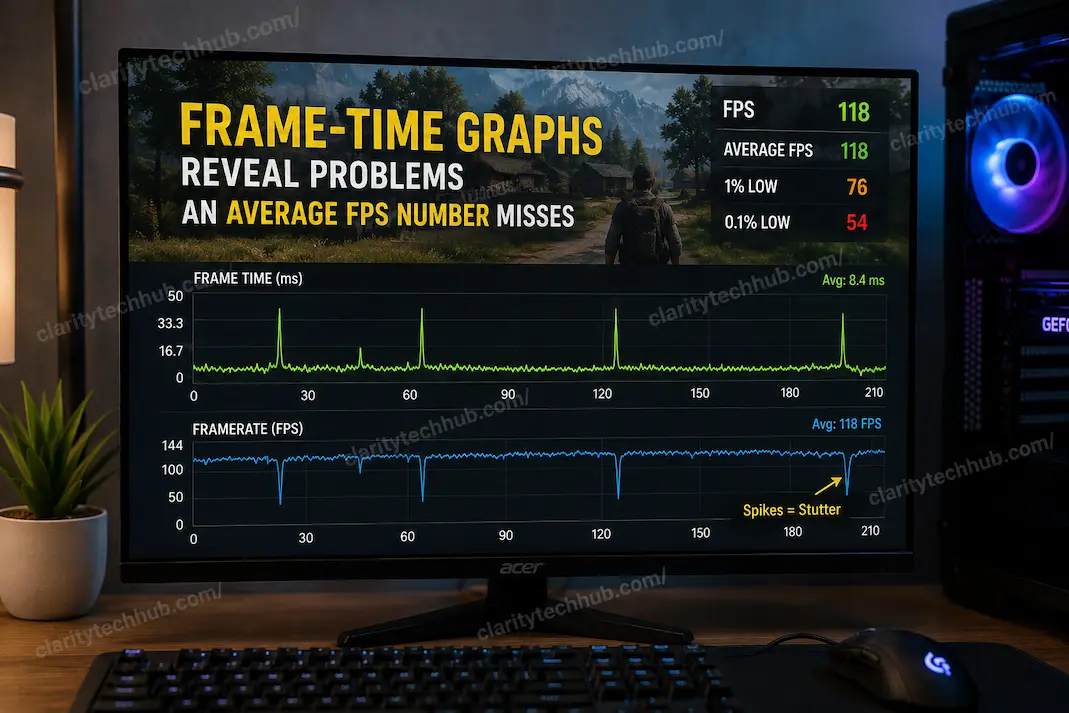
A game can report an excellent average FPS and still feel noticeably uneven. This is one of the more confusing performance situations because the number most players watch appears to say everything is fine. A counter showing 120 FPS, for example, sounds like the game should be running smoothly, yet the image may occasionally hitch, pause for a fraction of a second, or feel inconsistent when the camera moves. The missing piece is often frame time, which measures how long the game takes to produce each individual frame rather than simply counting how many frames were produced over a longer period.
Average FPS is useful, but it compresses a large amount of information into one number. A short period of severe stuttering can be hidden by hundreds of otherwise normal frames, leaving the average looking healthy. A frame-time graph preserves the variation between individual frames, making those irregularities visible. For diagnosing gaming performance, that difference is important because perceived smoothness depends not only on how many frames are rendered but also on how consistently they arrive.
FPS and frame time describe the same performance from different angles.
FPS tells you how many frames are being produced over a period, while frame time tells you how long each frame takes to appear in the rendering pipeline. The two measurements are directly related, but they answer different questions. If a game consistently renders at 60 FPS, each frame takes roughly 16.7 milliseconds to produce. At 120 FPS, the target is roughly 8.3 milliseconds per frame. What matters for smoothness is whether successive frames stay close to those expected intervals rather than occasionally taking much longer.
This is why a game can show a respectable average while still feeling uneven. Imagine that most frames are generated around 8 milliseconds apart, but several frames suddenly take 30, 50, or 80 milliseconds. Those longer frames are relatively rare compared with the total number of frames, so the average FPS may barely change. Your eyes and controls can still notice the interruption because one frame has taken substantially longer than the frames immediately before and after it.
| Average frame rate | Approximate frame time | General implication |
|---|---|---|
| 60 FPS | 16.7 ms | One frame about every 16.7 ms |
| 90 FPS | 11.1 ms | One frame about every 11.1 ms |
| 120 FPS | 8.3 ms | One frame about every 8.3 ms |
| 144 FPS | 6.9 ms | One frame about every 6.9 ms |
| 240 FPS | 4.2 ms | One frame about every 4.2 ms |
These values describe the expected interval when the frame rate is consistent. They don’t mean that a particular FPS target automatically guarantees smoothness.
A Graph Can Show What The Average Hides
Consider two short gameplay sequences that both average around 120 FPS. In the first sequence, almost every frame arrives close to 8.3 milliseconds. In the second, most frames are also around 8.3 milliseconds, but several jump to 25 or 40 milliseconds. Mathematically, the averages can remain similar enough to look reassuring, while the second sequence feels much worse during those spikes.
This is the main reason frame-time graphs are useful for diagnosis. Instead of asking only, “How many frames am I getting?” you can ask, “Are the frames arriving consistently?” A relatively flat graph generally indicates consistent frame delivery, while sharp upward spikes show moments where individual frames took substantially longer than their neighbors. The graph therefore gives you information about stability, not just output quantity.
It also helps explain complaints that otherwise sound contradictory. Someone can honestly say that a game runs at 100–120 FPS and still experiences stuttering. Both observations can be true because the average or displayed FPS number doesn’t describe every frame individually.
The Shape Of The Graph Matters
A frame-time graph doesn’t need to be perfectly flat to represent good performance. Small variations are normal because games constantly perform different tasks. The useful question is whether the variations are minor and infrequent or whether the graph contains repeated, pronounced spikes that correspond with visible interruptions.
A relatively stable sequence might move slightly above and below its normal level as different scenes are rendered. A problematic sequence can contain tall spikes separated by otherwise normal frames. Repeated spikes at regular intervals suggest a different type of problem from occasional spikes that happen only when entering a new area.
The pattern can therefore provide clues about what to investigate next. A single spike may be caused by an isolated event, while regular spikes could point toward background activity, asset processing, synchronization behavior, or another recurring workload.
Not Every Spike Means The GPU Is Too Slow
One of the easiest mistakes is assuming that a frame-time spike automatically means the graphics card has reached its limit. A longer frame can result from many parts of the system taking longer than usual.
The CPU may suddenly have more game logic to process, the game may load assets from storage, shaders may be compiled, a background process may become active, or the engine may temporarily perform another task that delays the next frame. Even if GPU utilization doesn’t reach 100%, the game can still experience a frame-time spike.
This is where frame-time analysis becomes more useful than simply looking at GPU usage. The graph tells you when the frame took longer. Other monitoring information can then help determine what was happening at that same moment.
CPU usage can look normal while a game stutters.
Total CPU utilization can be misleading when diagnosing frame-time problems. A game may rely heavily on one or a few CPU threads while the remaining cores are relatively idle. The overall CPU percentage can therefore look moderate even though the thread responsible for a particular workload is temporarily struggling to keep up.
Suppose a processor has sixteen logical threads and the game heavily depends on one thread during a particular scene. A major slowdown on that thread may not produce anything close to 100% total CPU usage. Looking only at the overall percentage could therefore lead you to conclude that the processor isn’t involved.
When a frame-time graph shows repeated spikes, checking per-core or per-thread behavior can provide more useful evidence than the overall CPU percentage. The goal isn’t to find a single percentage that proves the cause but to see whether CPU activity changes at the same moments as the frame-time disturbances.
GPU Utilization Tells A Different Story
GPU usage is still valuable, but it needs to be interpreted alongside frame time. If the GPU is consistently near full utilization while frame times rise, the graphics workload may genuinely be too demanding for the selected settings or resolution.
If GPU utilization suddenly falls at exactly the moment frame time spikes, the graphics card may actually be waiting for something else. The CPU, storage subsystem, game engine, or another process could be preventing the GPU from receiving work quickly enough.
This is one reason a simple statement such as “GPU usage is only 70%, so the GPU isn’t the problem” isn’t sufficient. Likewise, “GPU usage reached 99%, so the GPU caused the stutter” doesn’t prove causation. The timing between the measurements matters.
Frame-Time Spikes Can Point Toward Asset Streaming
Open-world games and large environments frequently load new assets while you move through the world. Textures, models, audio, and other resources may need to be retrieved and processed as new areas become visible.
If stutters repeatedly occur when entering particular areas, a frame-time graph can make that relationship easier to identify. You may see a spike at the same point where the game begins loading additional content, even though average FPS before and after the event looks perfectly acceptable.
Storage performance can become relevant here, but it isn’t automatically the culprit. Asset streaming can involve CPU processing, decompression, memory management, and engine-level scheduling as well. The useful diagnostic result is that the spikes occur at a repeatable point, giving you something specific to investigate rather than simply labeling the entire game as “low FPS.”
Regular Spikes Are Different From Occasional Spikes
The timing of frame-time spikes can be surprisingly informative. If the graph contains a spike every few seconds with remarkable consistency, something recurring may be responsible. Background software, polling behavior, synchronization, monitoring utilities, or scheduled system activity can sometimes produce periodic workloads.
By contrast, isolated spikes that occur only when entering a new location or triggering a particular effect suggest an event tied to the game itself.
This doesn’t provide a guaranteed diagnosis, but it changes how you should test the problem. For recurring spikes, you can look for something that runs on a schedule. For scene-specific spikes, reproduce the same movement or action and see whether the graph responds in the same place.
Reproducibility is valuable because a problem that can be triggered consistently is much easier to investigate than random stuttering.
A High Average FPS Doesn’t Guarantee Good Frame Pacing
Frame pacing refers to how consistently frames are delivered over time. Two games can have the same average FPS while providing very different experiences because one delivers frames at relatively regular intervals and the other produces uneven gaps.
This is particularly noticeable when the frame rate is high enough that players expect very smooth motion. At higher refresh rates, individual irregularities can become easier to notice because the expected time between frames is shorter.
A game averaging 144 FPS isn’t automatically smoother than one averaging 100 FPS in every situation. If the 144-FPS game has significant frame-time spikes while the 100-FPS game maintains consistent delivery, the latter may feel more stable during actual gameplay.
That doesn’t mean average FPS is useless. It remains a valuable performance measurement. It simply shouldn’t be treated as the complete picture.
Refresh Rate Adds Another Piece To The Diagnosis
The display also matters because the monitor determines how frequently it can present new frames. A game producing frames at inconsistent intervals can feel uneven even when the average frame rate appears appropriate for the display.
Variable-refresh-rate technologies can help synchronize the display’s refresh behavior with changing frame delivery within their supported operating range. However, they don’t eliminate the underlying workload that caused a frame to take unusually long to render.
If a frame takes substantially longer than normal because the game is processing something heavy, the display technology can’t manufacture the missing frame. It can improve presentation under varying frame rates, but a diagnostic graph can still reveal that the game’s frame production itself is inconsistent.
Use the same scene when comparing changes.
Frame-time analysis becomes much more useful when comparisons are made under similar conditions. If you change a graphics setting and then run through a completely different part of the game, you can’t easily determine whether the setting caused the performance change.
Instead, reproduce the same camera movement, location, or gameplay sequence when possible. Keep resolution, graphics settings, frame rate limits, and background applications consistent while testing one variable.
A short repeatable route through a demanding section can be more informative than a long benchmark with constantly changing conditions. You’re trying to establish whether a particular change alters the pattern of frame-time spikes, not simply whether one session happened to produce a higher average number.
Don’t Treat Every Tall Spike As A Major Problem
Frame-time graphs can also be overinterpreted. A single isolated spike may be visible on a graph but never noticeable during normal play. If the game otherwise delivers consistent frames and the spike occurs during a transition, menu interaction, or other moment that isn’t part of actual gameplay, it may not matter much.
The goal is to connect graph behavior with something you can actually observe. If you feel a hitch and the graph shows a significant spike at exactly the same moment, the measurement has become useful evidence.
This is much stronger than looking at a graph after the fact and declaring every irregularity a problem. Diagnostics should connect measurements with real-world symptoms rather than turning every imperfect number into something that needs fixing.
What To Record During A Performance Test
A useful diagnostic session doesn’t require dozens of measurements. A small set of synchronized observations can provide considerably more information.
| Metric | What it can help reveal |
|---|---|
| Frame time | Consistency of frame delivery |
| Average FPS | Overall rendering rate |
| 1% lows | Performance during slower portions |
| GPU utilization | Whether the GPU is consistently busy |
| CPU utilization | Overall processor workload |
| Per-core CPU activity | Possible CPU-thread limitations |
| GPU temperature | Thermal behavior |
| CPU temperature | Processor thermal behavior |
| RAM usage | System-memory pressure |
| VRAM usage | Graphics-memory pressure |
| Disk activity | Possible storage involvement |
The important part isn’t collecting every metric available. It’s comparing them against the exact moments where frame-time spikes occur. A graph becomes much more useful when another measurement changes at the same time.
1% Lows Add Context, But They Aren’t A Replacement
You may also encounter the term “1% low FPS” in gaming benchmarks. This attempts to describe performance during the slower portion of a test rather than relying exclusively on the average.
It can be useful when comparing systems or settings, but it still summarizes multiple frames into one number. A detailed frame-time graph can show whether those slower frames were distributed gradually or whether a few severe spikes created the problem.
For that reason, average FPS, low-percentile performance, and frame-time graphs work best together. The average tells you about overall output, a low-percentile figure gives you information about slower moments, and the graph shows how those variations were distributed throughout the test.
A Simple Diagnostic Method Works Better Than Guessing
When a game feels uneven despite a good FPS number, begin by reproducing the problem in a consistent section of gameplay. Record the frame-time graph and average FPS during the same sequence, then note when the visible hitch occurs.
After that, compare CPU and GPU activity around the spike. If the GPU is saturated, the graphics workload may deserve attention. If GPU usage falls while CPU activity or another system metric changes, the graphics card may be waiting for another part of the system. If disk activity rises at the same moment, storage or asset processing becomes another possibility.
The important part is that each observation narrows the possibilities. You aren’t trying to prove the cause from one graph alone. You’re building a timeline of what the computer was doing when the game stopped delivering frames consistently.
The Graph Often Explains What The FPS Counter Cannot
Average FPS is one of the easiest methods to describe game performance; however, it doesn’t evaluate smoothness. It hides the time of individual frames but shows the average number of frames produced.
Frame-time graphs provide that information. It can reveal whether frames arrive at constant intervals, whether extended frames break smooth gameplay, and whether the problem happens at specific times. Comparing spikes to CPU, GPU, storage, and other system activity makes them diagnostic evidence rather than performance numbers.
Frame-time analysis is useful when a game appears odd despite a good FPS. Before lowering graphics settings or presuming hardware is slow, determine what’s happening during the stutter. Sometimes the issue is rendering load, sometimes CPU-side work, and occasionally a transient event that average FPS isn’t designed to reveal. So “How high is my FPS?” isn’t the best question. Yet, “How consistently is each frame being delivered?” Frame-time graphs provide that data.
FAQs
1. Is average FPS enough to determine whether a game is running smoothly?
No. Average FPS describes the overall number of frames produced over a period, but it doesn’t show how consistently those frames arrived. A game can have a high average while still experiencing noticeable frame-time spikes.
2. What does a frame-time spike mean?
A spike means an individual frame, or a small group of frames, took longer to produce than the surrounding frames. The cause could involve CPU processing, GPU workload, asset streaming, storage activity, shader compilation, background processes, or other engine behavior.
3. Is a flat frame-time graph always better?
Generally, consistent frame times indicate more even frame delivery, but a perfectly flat graph isn’t a realistic requirement. Small variations are normal. The more useful concern is whether large or repeated spikes coincide with noticeable stuttering.
4. Why can GPU usage drop when a game stutters?
The GPU may be waiting for another part of the system to provide work. A CPU-side bottleneck, asset loading, synchronization, or another engine task can delay the rendering pipeline, causing GPU utilization to fall while frame time rises.
5. Can a game feel worse at a higher average FPS?
Yes. Average FPS doesn’t describe consistency. A game producing a higher average but suffering frequent frame-time spikes can feel less stable than a game with a lower average and more consistent frame delivery.