
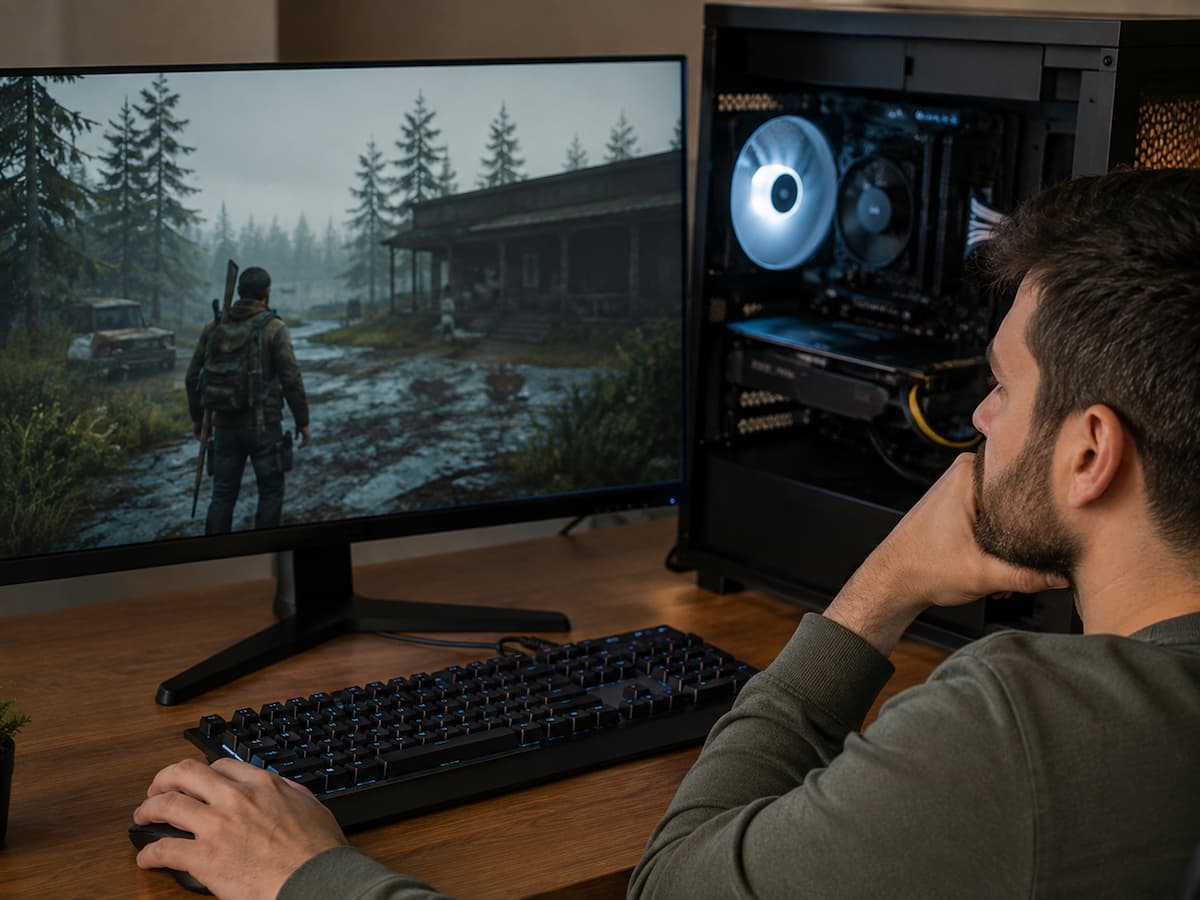
A sudden FPS collapse usually makes people look at the graphics card first. That seems logical. If a game drops from 120 FPS to 35 FPS, something must be wrong with the GPU—especially if the problem happens during an intense scene. But there is an important pattern that points in a different direction: GPU usage falls at the same moment as the frame rate collapses.
When that happens, the graphics card may not be the component causing the slowdown. Often, it is receiving less work because another part of the system has temporarily delayed the rendering pipeline. The GPU becomes underutilized because it is waiting. That distinction matters. If the GPU is struggling with a graphics workload, utilization often remains high while frame rates fall. If GPU utilization suddenly drops alongside FPS, the system may instead be CPU-bound, waiting on game data, experiencing memory pressure, encountering a synchronization stall, or being interrupted by another process.
GPU utilization and frame rate should therefore be examined together rather than separately. Microsoft’s documentation on CPU- and GPU-bounded applications explains that a CPU-bound application can leave the GPU idle because the processor is not generating rendering work quickly enough.
What a Sudden GPU Usage Drop Actually Means
A GPU cannot render a frame until it has received the work required to create that frame. The game engine first has to process information and prepare rendering instructions. Depending on the game, the process may involve game logic, physics, artificial intelligence, animation, object visibility, world management, draw-call preparation, and other tasks. The resulting work is then submitted to the GPU.
As long as that pipeline continues supplying work quickly enough, the GPU can remain heavily utilized. But imagine that something interrupts the process. The CPU may suddenly spend additional time processing a busy area. A game thread may wait for another thread to finish. New assets may need to be loaded. Memory may need to be managed. A background process may briefly compete for resources.
During that interruption, the GPU may have very little to do. GPU usage then falls, but the falling utilization is a symptom of missing work, not necessarily evidence that the graphics card itself has slowed down. Microsoft describes the CPU-bound case in similar terms: when the GPU can process the instructions it receives faster than the CPU can generate new work, the GPU spends time idle, and the frame rate becomes limited by the CPU side of the pipeline. This is why a graph showing GPU usage dropping from 95% to 45% at exactly the same time that FPS falls can be more informative than the FPS number alone.
The Difference Between a GPU Bottleneck and a Pipeline Stall
Two different performance problems can produce a low frame rate. In the first situation, the GPU runs at full capacity. For example, a demanding game running at a high resolution with ray tracing and maximum visual settings may push the graphics card close to its limit. GPU usage remains high because the GPU is continuously working, but each frame takes longer to render.
In the second situation, the GPU has idle time. The frame rate may still collapse, but the graphics card no longer heavily utilizes its resources because it is waiting for something else.
| Performance Pattern | GPU Usage | FPS | Likely Direction to Investigate |
|---|---|---|---|
| GPU working continuously | High | Low or declining | Graphics workload, resolution, GPU settings |
| GPU usage falls with FPS | Low or suddenly reduced | Suddenly low | CPU, game stalls, memory, streaming, background activity |
| GPU usage fluctuates heavily | Variable | Variable | Scene changes, bottleneck shifts, inconsistent workload |
| GPU usage is low but FPS is capped | Low or moderate | Stable | Frame limiter, V-Sync, refresh or synchronization behavior |
This table should not be treated as a complete diagnosis. A utilization number alone cannot identify the exact cause. The useful clue is the relationship between GPU usage, frame rate, frame time, and what is happening at the moment performance changes. Microsoft’s graphics profiling tools similarly collect frame timing, FPS, and GPU utilization on a shared timeline because examining how these measurements change together can help identify where a slowdown occurs.
CPU Bottlenecks Can Leave the GPU Waiting
A sudden drop in GPU utilization is frequently associated with CPU limitations. This does not necessarily mean the processor is too weak for the entire game. A game can run perfectly well in one situation and become temporarily CPU-limited in another. Consider an open-world game.
Walking through an empty road may require relatively little CPU work. Entering a crowded area may suddenly increase the number of characters, physics calculations, animations, objects, AI routines, and world updates that the CPU must process. The GPU may be capable of rendering the scene quickly, but it cannot begin the next frame until the required instructions are ready.
- FPS falls.
- GPU usage also falls.
- The graphics card may now be waiting rather than struggling.
A misleading detail is that overall CPU utilization may not look particularly high. Games do not always distribute their workload evenly across every available CPU core. A heavily used game thread can become the limiting factor while the overall CPU percentage remains far below 100%.
Microsoft notes that CPU- and GPU-boundedness can change depending on the hardware, game, settings, and even the particular scene being rendered. Lowering resolution, for example, can reduce GPU workload without necessarily solving a CPU limitation. This is why reducing resolution may provide an important clue. If the game loses a large amount of FPS during a particular event and lowering resolution barely improves that moment, the GPU may not be the primary limitation.
A Frame-Time Spike Can Make Both FPS and GPU Usage Look Bad
FPS counters are useful, but sudden performance problems are often easier to understand through frame time. At 100 FPS, the system is producing a frame approximately every 10 milliseconds. At 50 FPS, each frame takes around 20 milliseconds.
But performance does not always decline smoothly. A game might normally produce frames in 8 milliseconds and then suddenly take 70 milliseconds to complete one frame. That single delay can feel like a noticeable hitch.
During the stall, GPU usage may drop because the graphics card has completed its available work and is waiting for the next stage of the pipeline. This is why a frame-time graph can reveal problems that an average FPS number hides. A useful monitoring setup should ideally show the following:
- FPS.
- Frame time.
- GPU utilization.
- CPU behavior.
- GPU and CPU clock speeds.
- Temperatures.
- System RAM usage.
- VRAM usage where available.
AMD’s performance monitoring documentation includes metrics such as frame rate, frame time, percentile FPS, stutter rate, GPU utilization, clock speed, and board power, while NVIDIA’s FrameView documentation describes metrics including percentile performance, dropped frames, CPU and GPU utilization, and temperatures. The goal is not to fill the screen with numbers. It is to capture the moment when the problem occurs and see which measurements change first.
Game Threads Can Stall Even When the CPU Seems Fine
Some performance interruptions happen because of waiting rather than raw computational demand. Modern games use multiple threads, and those threads can sometimes depend on one another. If one thread needs information from another before it can continue, a delay can affect the rest of the frame pipeline.
For example, one part of the game may finish quickly, but it then has to wait for another task to complete. The resulting pause can create a CPU frame-time spike. The GPU may receive less work during that period, causing utilization to fall. Microsoft’s PIX documentation specifically discusses CPU frame-time spikes caused by dependencies between threads, where one thread must wait for another to finish before it can continue. This type of problem is difficult to diagnose by looking only at average CPU usage.
You may see:
- CPU usage that appears moderate.
- GPU usage suddenly dropping.
- FPS briefly collapsing.
- A large frame-time spike.
- Performance immediately recovering afterward.
That pattern does not automatically mean there is a hardware fault. It can reflect how the game itself is scheduling or synchronizing work. For players, the practical lesson is simple: do not assume that low GPU usage means the GPU is underperforming. be that there isay simply have nothing useful to render for a short period.
Asset Streaming Can Interrupt the Rendering Pipeline
Many modern games continuously load data while you play. As you move through the game, the system streams textures, geometry, audio, animations, and world information rather than loading them entirely at startup. If the required data is not ready when the game needs it, performance can briefly stall.
Such delays may happen when:
- Entering a new area.
- Moving quickly through an open world.
- Turning toward a previously unseen environment.
- Triggering a major event.
- Encountering new objects or effects.
During the delay, GPU usage can fall because the game has temporarily stopped supplying enough rendering work. Storage performance may be relevant, but it is not the only factor. Asset streaming also involves CPU work, memory management, decompression, and the game’s own data-handling systems.
The pattern is often more useful than a general assumption about hardware. If the game stutters in exactly the same area every time, or only when crossing into a new section of the world, streaming behavior is a reasonable area to investigate. Microsoft’s DirectX profiling documentation also identifies file processing, physical memory, and thread synchronization among issues that can affect application performance.
Memory and VRAM Pressure Can Cause More Than a Simple FPS Drop
When memory resources become constrained, performance may become inconsistent. A game can require both system RAM and graphics memory. If available resources are under pressure, the system may need to move, reload, or manage data more aggressively.
The visible result can be sudden frame-time spikes rather than a smooth reduction in FPS. VRAM behavior is particularly dependent on the game and its memory-management approach. NVIDIA notes that behavior near available GPU memory limits can vary by application and may be associated with performance issues or instability. A useful test is to look for a relationship between the stutter and graphics settings.
For example:
- If reducing texture quality significantly improves the problem, VRAM pressure may deserve investigation.
- If reducing resolution has little effect but the problem occurs in CPU-heavy scenes, a CPU limitation is more likely.
- If performance becomes progressively worse during a long gaming session, memory usage and other accumulating resource demands may be worth monitoring.
Do not assume that maximum VRAM usage automatically proves a problem. The important question is whether memory behavior changes at the same time as the frame-time spikes.
Thermal or Power-Related Slowdowns Can Change the Whole Balance
Performance can also collapse when a component changes its operating behavior because of temperature or power conditions. A CPU slowdown can be particularly confusing because it may indirectly reduce GPU utilization. Suppose the processor runs normally for ten minutes, then reduces its operating frequency under certain conditions. The CPU may now prepare frames more slowly. The GPU receives less work, so utilization falls.
The symptom can look like a GPU problem even though the graphics card is only responding to a slower pipeline. Steam’s hardware troubleshooting guidance notes that sudden slowdowns can be associated with CPU slowdowns caused by overheating or power-saving behavior and suggests that a lack of improvement after lowering resolution can indicate CPU-limited performance. This does not mean that overheating causes every FPS collapse.
Instead, compare performance measurements before and during the slowdown. If clock speeds or power behavior change at the same moment that FPS and GPU usage collapse, that relationship is worth investigating. Laptop users should also pay attention to power settings, battery operation, and manufacturer-specific performance modes because these can affect CPU and GPU behavior.
Background Processes and Overlays Can Create Short Interruptions
A game shares the computer with the operating system and other applications. Background updates, recording software, browser activity, cloud synchronization, hardware monitoring utilities, RGB software, antivirus activity, and overlays can all consume resources.
Usually, these programs do not continuously destroy gaming performance. The more revealing situation is an intermittent interruption. For example, a game may run smoothly for several minutes before FPS suddenly collapses for a second. GPU usage drops at the same moment. Then everything immediately returns to normal. A background task may be involved.
Possible sources include:
- Multiple overlays running simultaneously.
- Recording or streaming software.
- Background downloads.
- Browser applications using significant resources.
- Cloud synchronization.
- Scheduled scanning or update activity.
- Monitoring utilities’ polling hardware aggressively.
The correct troubleshooting approach is not to permanently disable everything. Test likely sources individually and reproduce the problem. Changing one variable at a time provides evidence. Disabling ten applications at once only proves that something changed.
Why Lowering Graphics Settings May Not Fix the Collapse
When FPS falls, lowering graphics quality is often the first response. That makes sense when the GPU is saturated. Lower settings can reduce rendering work and allow frames to complete more quickly. But if GPU usage has already fallen dramatically during the slowdown, reducing visual settings may not address the real bottleneck. Imagine these two scenarios.
- In the first, a game drops from 90 FPS to 55 FPS while GPU usage stays near maximum. Lowering resolution or other GPU-heavy settings may help.
- In the second, the game drops from 90 FPS to 30 FPS while GPU usage falls from 98% to 45%. The graphics card is no longer continuously busy.
- Lowering resolution might increase the normal frame rate while doing almost nothing to solve the sudden collapse.
Microsoft’s explanation of CPU- and GPU-bounded performance makes this distinction clear: reducing GPU workload can shift a system toward being CPU-bound rather than improving the CPU-side limitation itself. This is why troubleshooting should begin with identifying the bottleneck rather than applying the same graphics adjustments to every problem.
How to Diagnose the Problem Without Randomly Changing Everything
The most useful approach is to reproduce the FPS collapse while monitoring several related measurements. Start with frame time, FPS, GPU utilization, and CPU behavior. When the problem occurs, ask what changed first.
1. If FPS drops but GPU usage remains high
The GPU workload may be the primary limitation. Test resolution, GPU-heavy settings, and other visual features that significantly affect rendering time.
2. If FPS and GPU usage both drop suddenly
Investigate whether the CPU is stalling, clocks are changing, memory resources are under pressure, new assets are loading, or another process is interrupting the game.
3. If lowering resolution does not improve the collapse
The problem may not be primarily GPU-limited. Look more closely at CPU behavior, game simulation, streaming, or synchronization.
4. If the problem happens in the same location
Try to identify what changes there. A busy area, new assets, increased AI activity, or a specific game event may be responsible.
5. If the problem appears after extended play
Monitor temperatures, clock speeds, RAM, VRAM, and background activity over time.
6. If the problem started after a game or driver change
Please review the relevant official release notes and known-issue documentation before making major system changes. Game updates, graphics drivers, and operating-system updates can alter performance behavior.
A controlled troubleshooting process is slower than changing settings randomly, but it usually produces a much clearer answer.
GPU Usage Is a Clue, Not a Verdict
GPU utilization is often misunderstood, as people expect a struggling game to show 100% GPU usage at all times. In reality, a low or suddenly falling GPU percentage can indicate several different situations. The game may be CPU-bound. It may be waiting for data. A frame may stall due to synchronization. The system may be hitting a power or thermal limitation. The game may simply be capped by its frame rate or display behavior.
The important thing is to see what happens at the moment performance collapses. GPU usage by itself answers only one question: how busy the monitored GPU engine appears to be. It does not automatically explain why it is busy or idle. More advanced profiling tools can examine timing, CPU activity, GPU activity, memory behavior, and presentation metrics together, which reflects the basic troubleshooting principle that performance problems often occur somewhere in the chain rather than inside one component alone.
Conclusion
When GPU usage falls while frame rates suddenly collapse, the graphics card may be the victim of the slowdown rather than the cause. A game needs a continuous flow of prepared work before the GPU can render frames. If the CPU falls behind, game threads stall, assets are not ready, memory management becomes expensive, clock speeds change, or another process interrupts the system, the GPU may simply run out of work.
That is why the combination of falling FPS and falling GPU utilization deserves closer investigation. The most useful measurements are not just average FPS or GPU usage. Watch frame times, CPU behavior, clock speeds, temperatures, RAM, VRAM, and the repeatable circumstances surrounding the problem.
A GPU sitting at 45% utilization during a severe FPS drop does not automatically need a replacement, a driver reinstall, or lower graphics settings. First determine why the rendering pipeline stopped feeding it. The goal is not to force GPU usage to 100%. The goal is to identify the component, process, or game behavior that is preventing frames from being delivered consistently.
FAQs
1. Why does my GPU usage drop when my frame rate drops?
A simultaneous drop in GPU usage and frame rate can mean that the GPU is waiting for tasks from other parts of the system. CPU bottlenecks, game thread freezes, resource streaming delays, memory issues, synchronization problems, or background interruptions can all temporarily prevent the GPU from getting enough work. Even with frame rate throttling, CPU-intensive applications can keep the GPU idle.
2. Is low GPU usage always caused by a CPU bottleneck?
Not necessarily. A CPU bottleneck is a possible cause, but low GPU usage can also be due to frame rate limits, vertical synchronization mechanisms, workload variations, power saving modes, temperature fluctuations, game engine freezes, or the way usage is measured. The relationship between GPU usage, frame time, frame rate, and system behavior says more than a single percentage value.
3. If the CPU is the gaming bottleneck, why isn’t my CPU usage 100%?
Total CPU usage is the average of available processing resources. A game can be severely slowed down by excessive use of one or more critical threads, rather than all cores being utilized evenly. Even if total CPU usage doesn’t seem high, it can still constitute a CPU performance bottleneck.
4. Should I lower graphics settings if GPU usage drops?
Not necessarily. Lowering GPU-intensive settings is most effective when the graphics card is the primary bottleneck. If GPU usage drops sharply during a period of performance degradation, lowering the resolution might not solve the underlying problem. Monitor frame times and GPU usage while testing changes to settings.
5. Can overheating cause a drop in GPU usage?
Yes, the effect can be indirect or direct, depending on which component is affected. If the CPU is slowed down by overheating or power issues, the slowdown can delay frame preparation, causing the GPU to wait. The clock frequency or power consumption of the GPU can also affect performance. Compare the temperature and clock frequency before and after a frame drop, rather than simply assuming that temperature is the cause.
6. Can memory or VRAM issues cause a sudden frame drop?
Memory or VRAM issues can cause performance instability when the game is under excessive memory load or has to move and manage data in another way. The specific manifestations depend on the game and the system. Monitoring memory usage and frame time spikes can help you determine whether resource pressure is causing the performance degradation.
7. Why does the game only stutter when entering certain areas?
Recurring stuttering in specific areas may indicate changes in CPU usage, resource streaming, new objects, AI activity, or other game workloads within that scene. Comparing the performance of that area to a simpler scene can determine whether the problem is environment-dependent.